
Welcome to Did You Know from Ask Approach. Throughout 2021 we’ll take a look at lesser-known aspects of services offered by Approach.
For a quick look at all of the services available to Approach clients, download our Approach Services infographic or check out our Service Spotlight blog posts.
Monthly claim and safety snapshots from Approach
As an Approach client, you get a detailed monthly report with the latest on each of your claims.
Did you know that this report also includes important safety data that can help you reduce workplace injuries and accidents?
The next report will be in your inbox on March 15, so let’s take a closer look at the valuable information you’ll find inside.
Check your email
To find your monthly report, look for an email with the subject – “Your Company Name Composite Claims Report”
Accident reports and safety trends
A picture says a thousand words, and in this case, we can see immediately how that’s true. It’s not hard to see that sprains and strains are a big cause of injury for this employer, with big claims costs to match. This employer won’t get an actual bill for $400,000, but you can bet this company will pay for that expense in the form of higher premiums and lower Retro refunds.
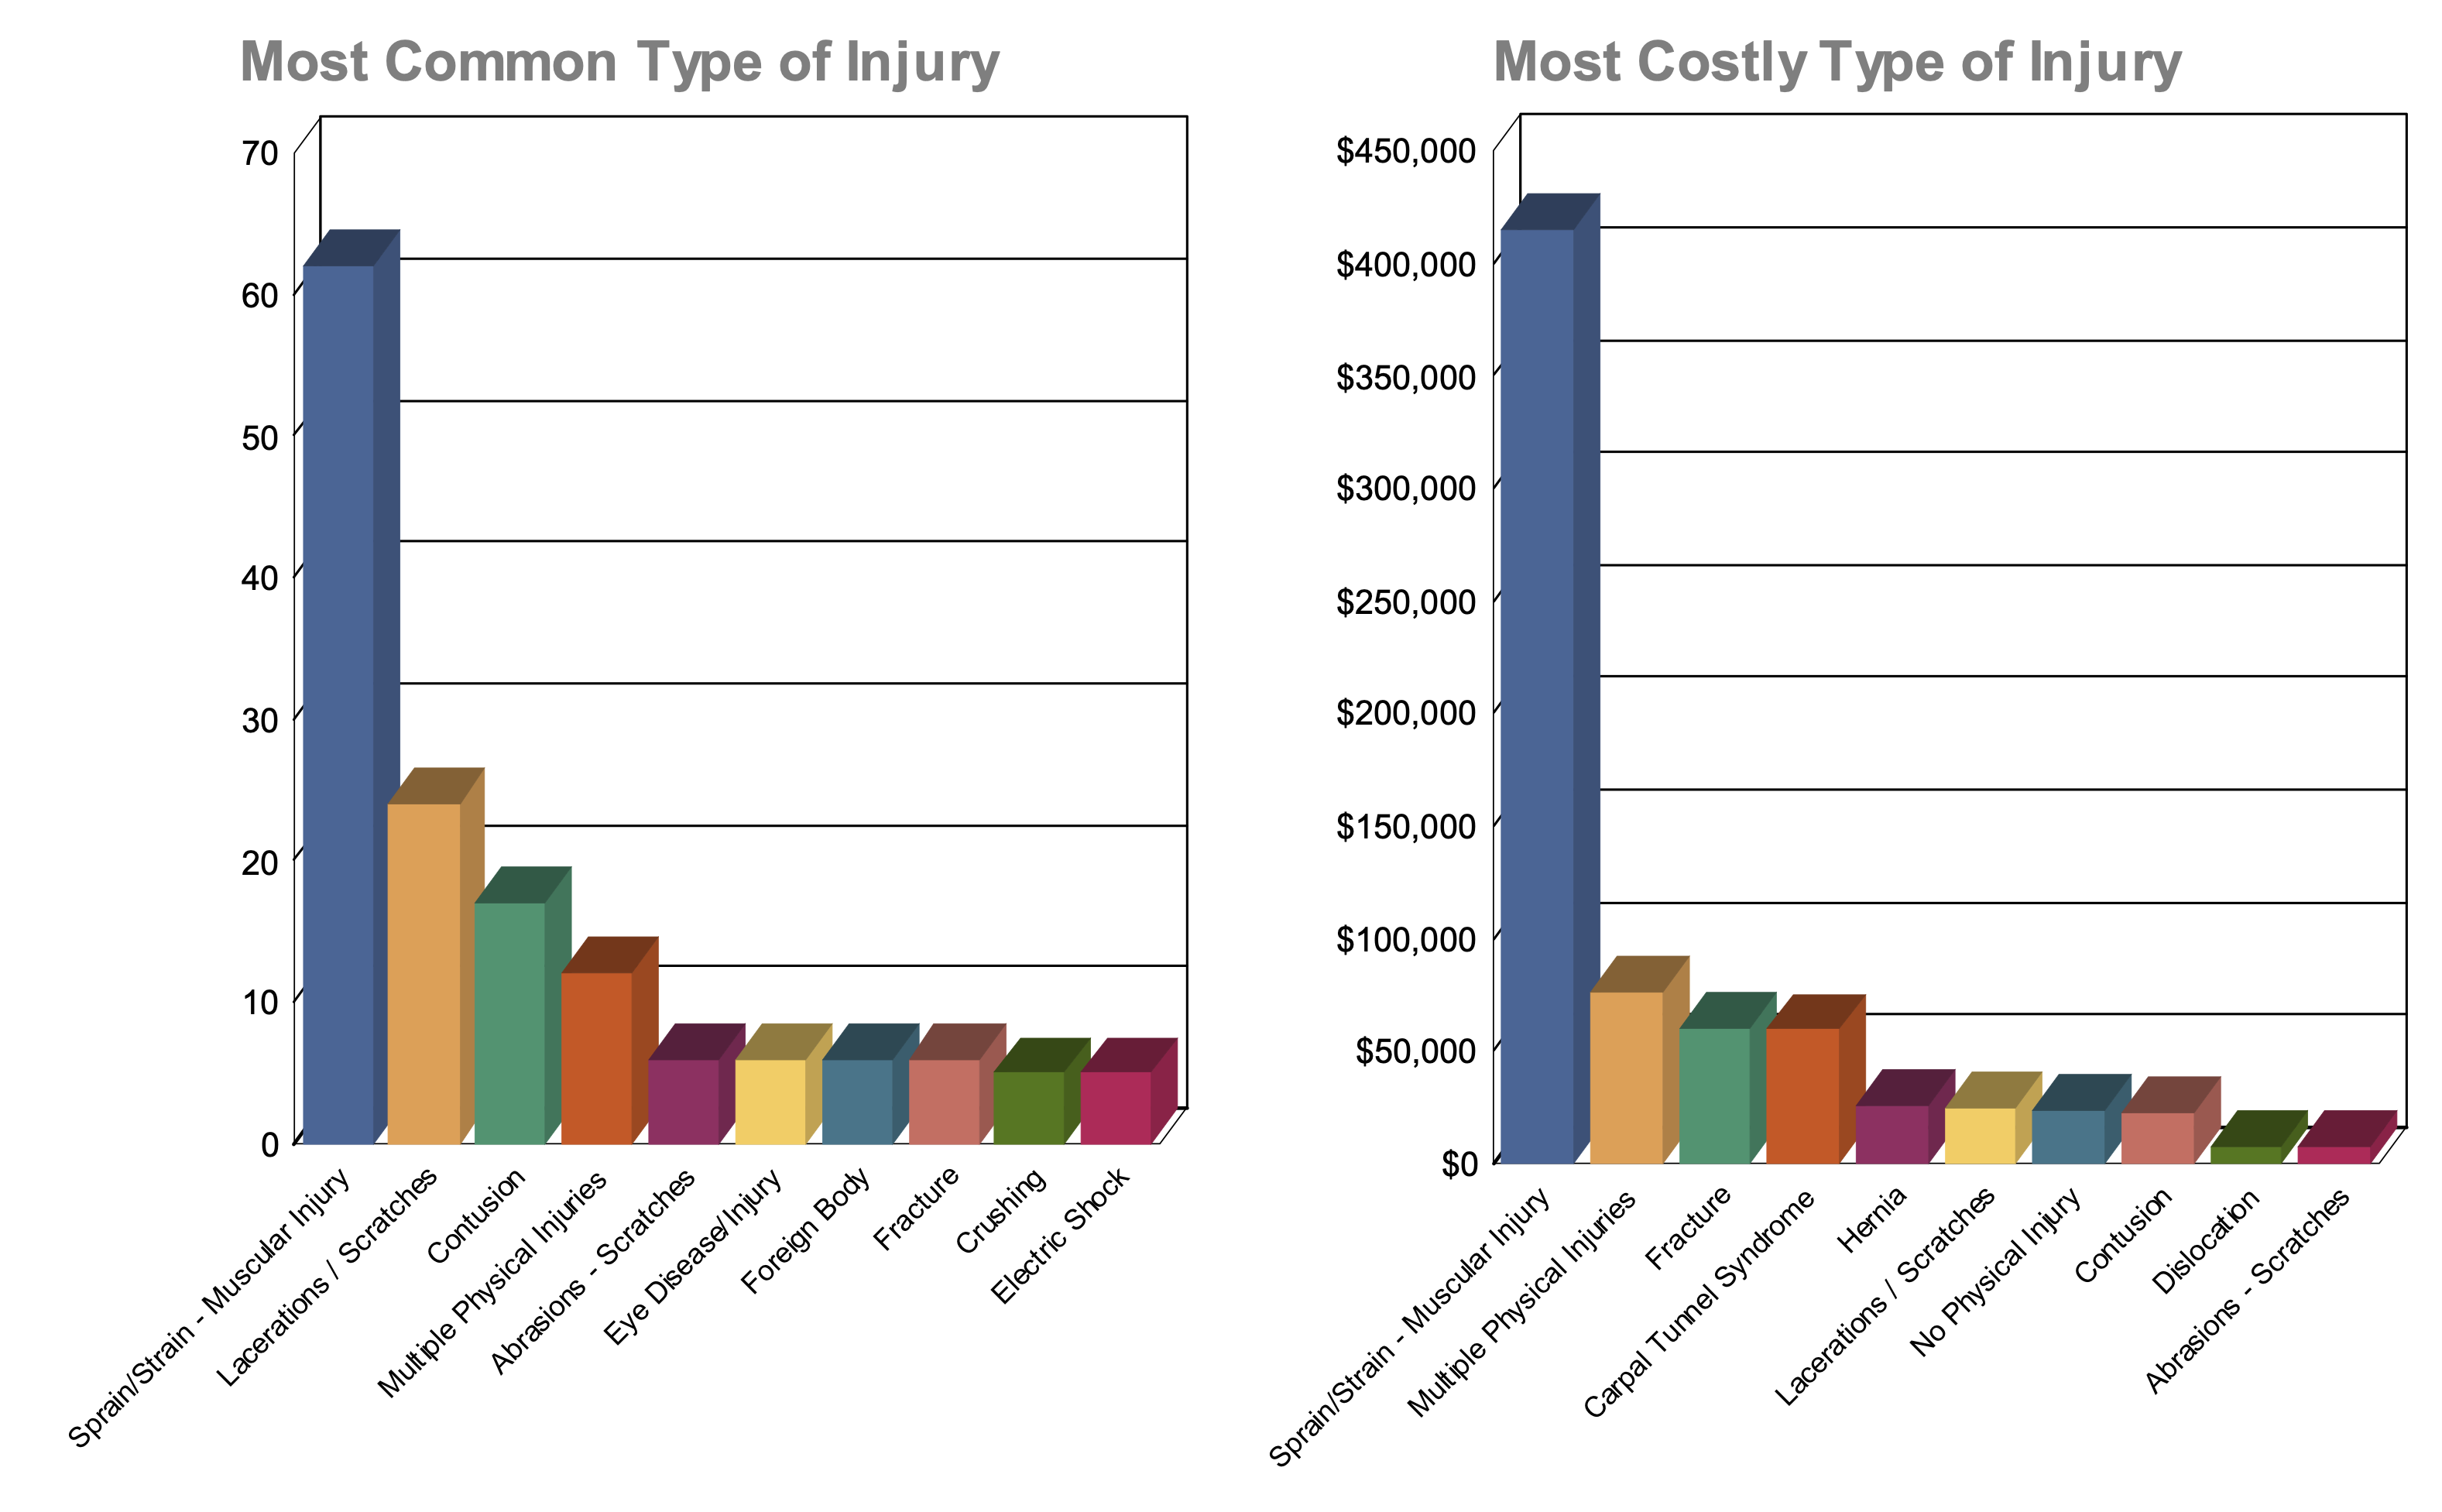
There’s nothing unusual about this employer, by the way. Overexertion, including sprains and strains, was the number two cause of claims for Approach clients in 2020. It’s also the number one cause of missed workdays nationwide, according to the National Safety Council.
Workplace injuries by category
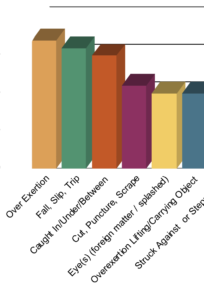 Claims data gives us a lot of information about workplace accidents. So, not only do we know the types of injuries employees are suffering, but we can also see what is leading to those injuries. For this employer, we can see three categories are higher than the others:
- Over exertion
- Fall, Slip, Trip
- Caught in/under/between
The safety team for this employer may want to start with these areas as they consider efforts to improve overall workplace safety.
Common and costly workplace injuries
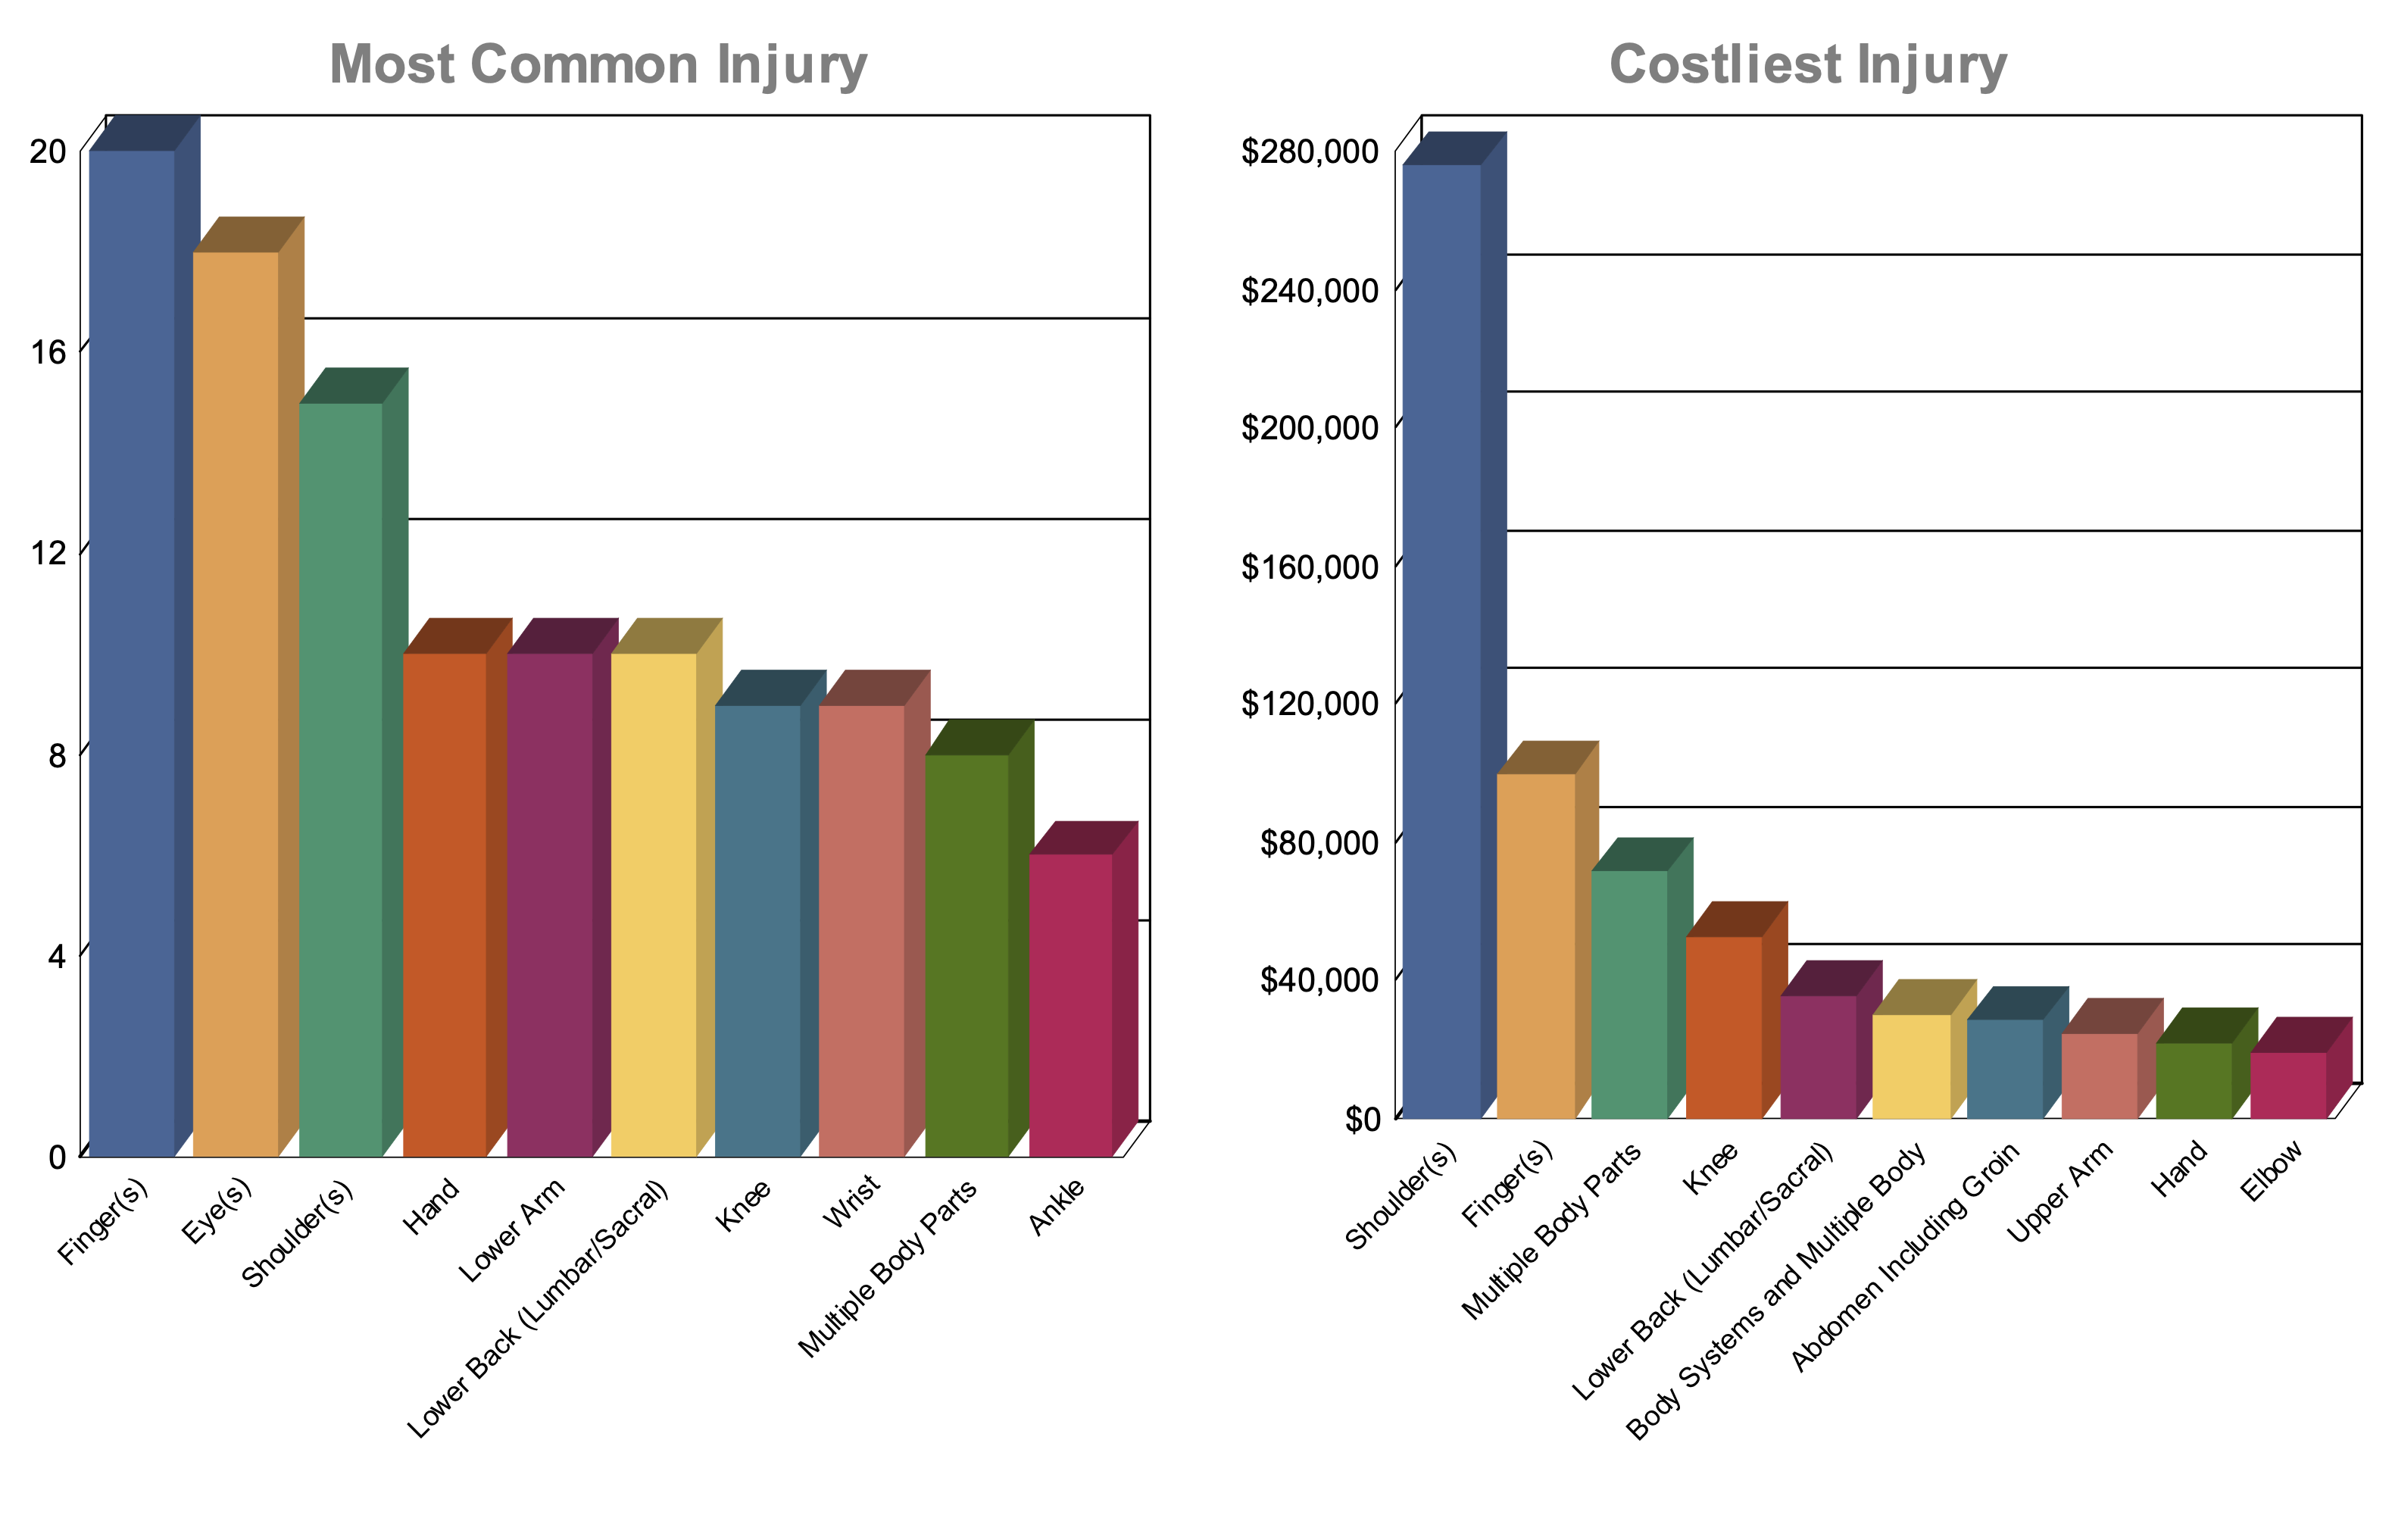
Let’s say your company is investing in new PPE, or that your safety team wants to know if PPE is being used consistently and properly. Working together, these charts give insight into the priorities for your company.
Overexertion, including sprains and strains, was the number two cause of claims for Approach clients in 2020.
For example, we can see that shoulder injuries are both high-frequency and high-cost. How can work practices and equipment be adjusted to reduce the number of injuries and their severity?
Eye and hand injuries also happen frequently for this employer, but the costs are quite low in comparison (eye injuries don’t even appear in the Costliest Injury chart). This could mean that the injuries are less severe. Could eye injuries be reduced with a simple, low-cost change – such as better enforcement of eye protection requirements in the workplace?
Workplace accidents by day or season
These graphs show how powerful information can be when we combine the data from many forms over a few years.
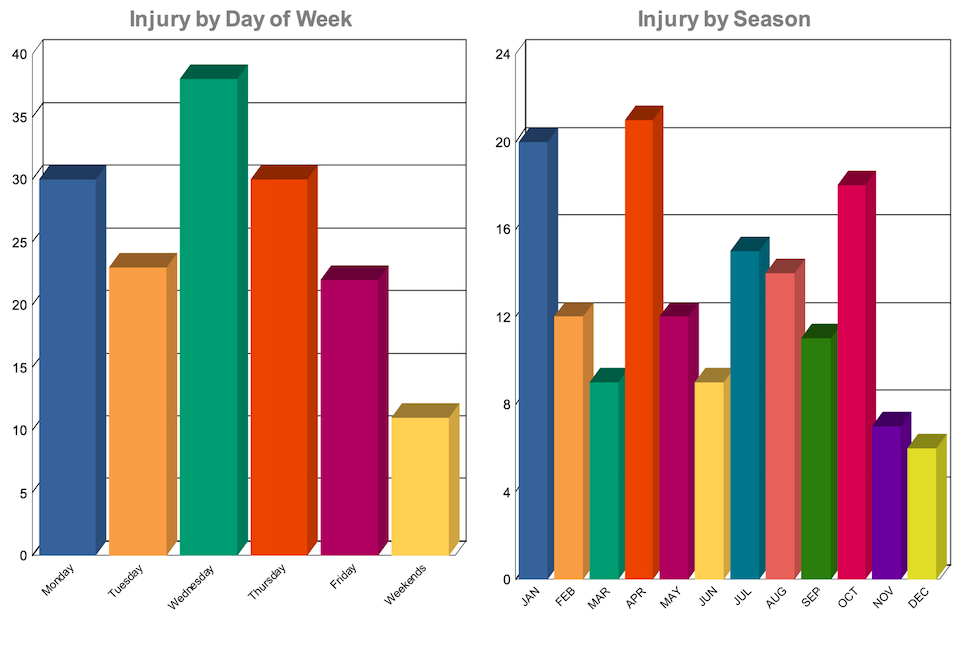
Now this employer can clearly see that Mondays and Wednesdays are higher risk days for their employers. It could be a coincidence or something more, but at least the safety team has information that can help them look deeper into what may be happening.
Also, because the reports contain data from multiple years, the employer can see that January, April, and October are higher risk months across a number of years. These aren’t just blips, but actionable data that can be acted upon to try and reduce the injury rate in those months.
Print this flyer with sample reports
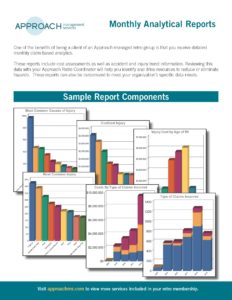
Custom reports and analysis
At Approach, we have a vast amount of data available from claim files to provide you with informative visual-based charts and graphs that can help you reduce workplace accidents and injuries. The ones we’ve mentioned above are automatically delivered to our clients monthly. If you need a custom report, it’s easy and available at no extra charge. Just contact your Approach Retro Coordinator for:
- A custom monthly report with the specific metrics that are important to you
- Analysis of safety and financial trends in your organization or industry
- Any combination of claims, safety, and financial data that we have on file for your company
![]()
You could even use this data to update your Accident Prevention Program. That’s the topic of our March Brain Trust, coming up on Thursday, March 18. Register now to attend!